
Optimizing a website for performance is hard, but that’s what makes it fun! When you plan to accomplish a goal, it’s never a good idea to go from 0 to 100 immediately. Whether it’s running a marathon, getting out of debt, or learning to wake up early in the morning – you have to take things one step at a time. This applies to improving performance as much as it does to these other examples.
The first step to improving your site’s performance is to establish a baseline of where it is at today. What we’ll need to do is a performance audit. This is an in-depth, instantaneous look at the performance of a website.
Enter Web Page Test
Web Page Test provides you with a very detailed view of what’s happening on your website. Here are a couple key metrics that you need to pull out and begin to document:
- Load Time (Document Complete Time)
- Time to First Byte *
- Start Render
- Speed Index **
- Fully Loaded Time
These are the high level items that you’ll want to be able to reference, but for this audit we’ll go a bit more in-depth to see what’s really going on behind the scenes. To do so, we’ll need to track data from each call that is made from the site. From each call, we’ll want to know:
- Mime Type
- URL
- Size (KB)
- Request Start Time
- DNS Lookup Time
- Initial connection time
- Time to First Byte
- Content Download Time
- Total Time Taken
Once you’ve arranged all of this data in a spreadsheet I’m sure your first question is something like this:
What does all of this data mean!?
You, probaby
With this information we’ll be able to pinpoint exact situations where we can improve, we just need to know what to look for. Let’s look at a quick example to outline a scenario that we should be looking for:
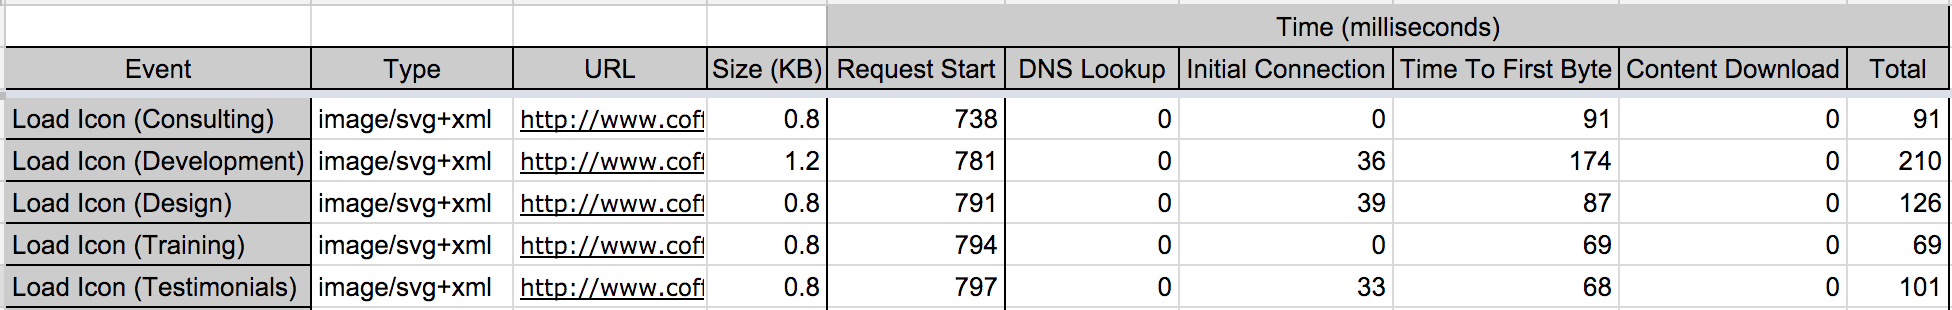
Here we can see that we’re loading in 5 SVG images. These images take a total of 597ms to perform a DNS lookup, establish a connection, and wait for a first byte. That means that half a second went by, and we haven’t even started to download these images! Granted, some of these things could be happening synchronously, but we can all agree that it’s a bit of a waste for five images that take 0ms to actually load because of their small size. An easy improvement to this is to create a sprite sheet, reducing all of the inherent network latency involved in calling a server five times over again into one call.
For those unfamiliar:
[Sprite Sheets] are important for website optimization because they combine several images into one image file to reduce HTTP requests.
From Guil Hernandez at the Team Treehouse Blog
Please keep in mind that the sprite sheet optimization technique (hack?) is for a website following the HTTP 1.x protocol. This is considered an anti-pattern in the newer HTTP2 protocol. You can read about the HTTP2 protocol here. For a more concise translation regarding the switch from HTTP1.x to HTTP2 check out this post by Matt Wilcox
This scenario should hopefully give you an insight into what we’re looking for as we sift through this data. Every site and scenario will be unique, so I’ll let you dissect away!
When all is said and done, you should be able to get some valuable data by aggregating the call times by sections. Ours came out looking like this (Y-Axis is time in milliseconds):
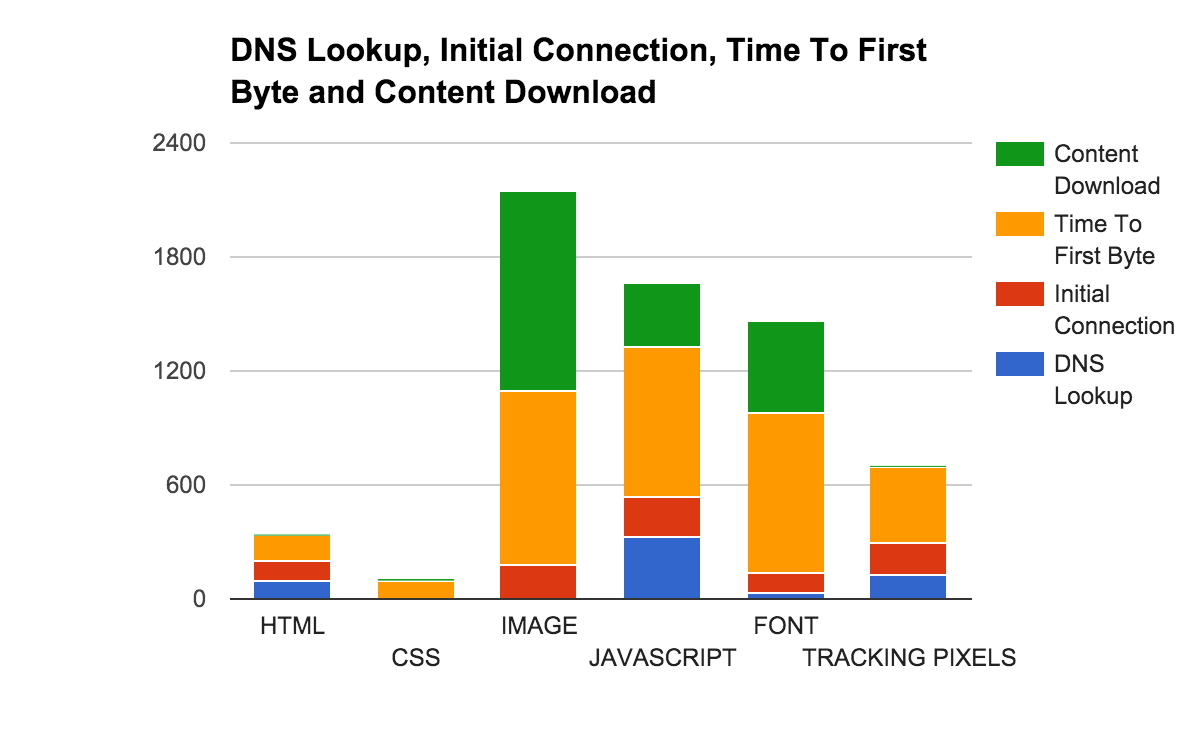
Are you noticing a lot of initial connection and time to first byte time, but not a lot of content download time? It seems like you might want to try combining some assets to make less HTTP requests! Are you seeing high content download times? You might want to try compressing your assets to decrease their size to a more reasonable level!
Hopefully with this information you’re ready to audit your own website and begin prioritizing performance!
* If you’re using a CDN like CloudFlare and Gzipping your files, you shouldn’t be worrying about the Time To First Byte metric as stated in this post by Cloudflare themselves.
** The math behind a Speed Index Score is very interesting, and best described in this page in the Web Page Test documentation.